After 14 years of collecting water quality data with my students on our neighborhood creek I finally have a way to get temperature over the summer to compare to the spring and winter! Thanks to the Olympic STEM Pathways Partnership (OSPP) work we’ve been doing I have temp sensors that I can put in the creek and just leave it there to collect data! I don’t have to get just one temperature reading OR keep going down to the creek everyday to get more data, I can just leave the sensors there collecting data at any interval I want. I set the sensors to collect data every half hour, one in the creek water and one in the soil, and left them there for a whole month. The batteries lasted three weeks so I got three weeks of data!

The entire new system with battery and PVC pipe that will serve as the waterproof casing.
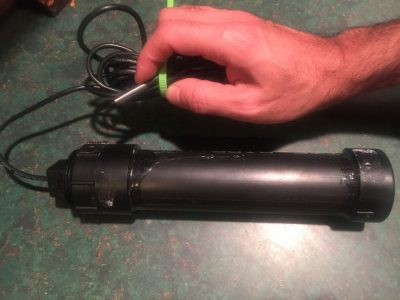
Here’s the new system with temperature sensor inside the water proof casing.
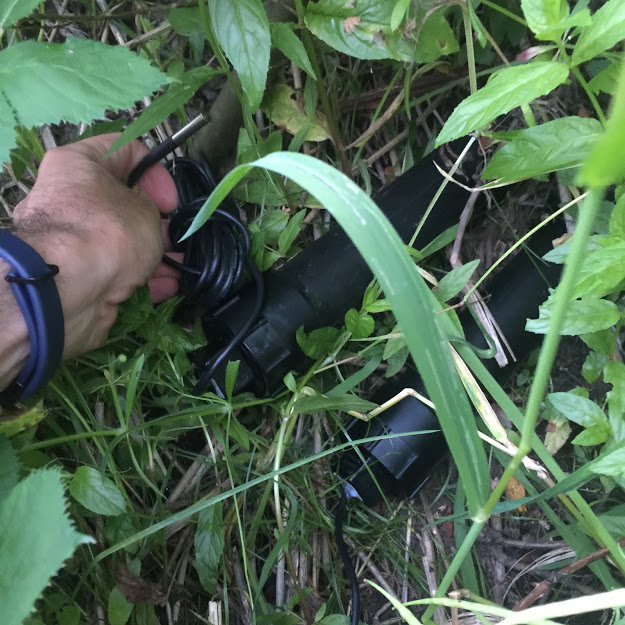
Here are the two sensor systems, well hidden and ready to collect data!
Here are the three week’s worth of temperature data at Chimacum Creek that I will be sharing with my students. I have water and soil temperature because I had two sensors and I added air temperature in green from checking weather sites:
Here are the averages for all three weeks:
Water Temp 63.9 Degrees F
Soil Temp 64.1 Degrees F
Air Temp 71.5 Degrees F
I plan to get similar temp data later in the fall, during the winter and of course during the spring when our environmental stewardship project launches! I’m so excited at this new way to collect data!