Wednesday and Thursday, June 29 and 30, we got to revisit the work we started last summer with the Olympic STEM Pathways Partnership (OSPP) using sensors to collect temperature data with our students. Last year we used these Raspberry Pi-like computers called Odroids with a temperature sensor. They were clunky and difficult to work with mostly because they used quite a bit of power so couldn’t collect data for very long.
So this year the incredible UW team we worked with used mini-controllers (or some such thing – I’m not sure) to attach the temperature sensors that are much more efficient making them able to collect data for much longer periods of time.
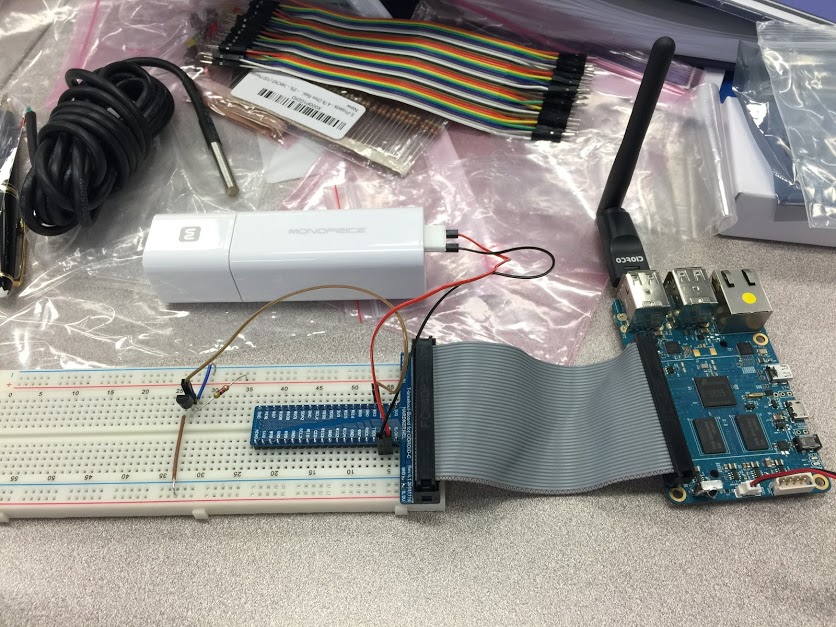
Odroid with breadboard and battery.
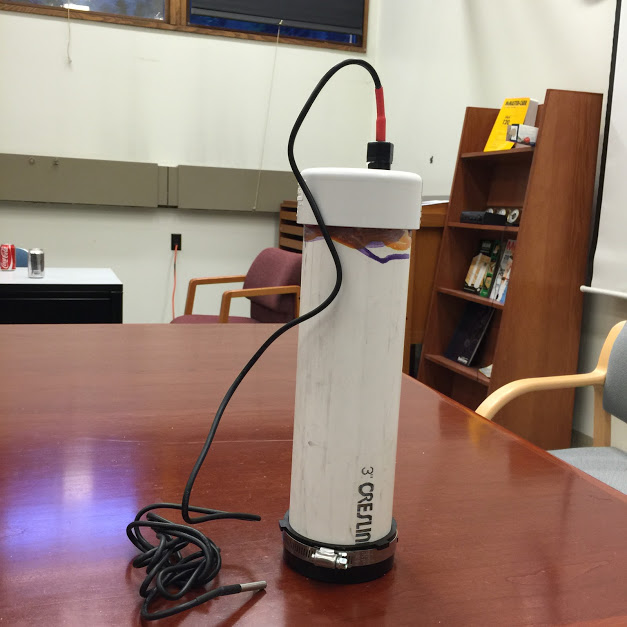
Temperature Sensor System in a water proof casing!
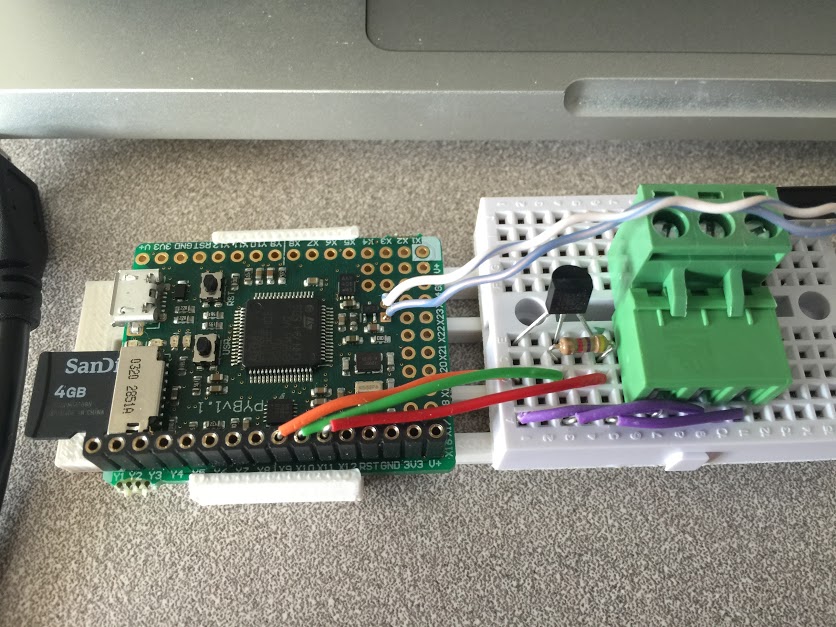
Micro Controller system with smaller breadboard and temperature sensor wires attached.
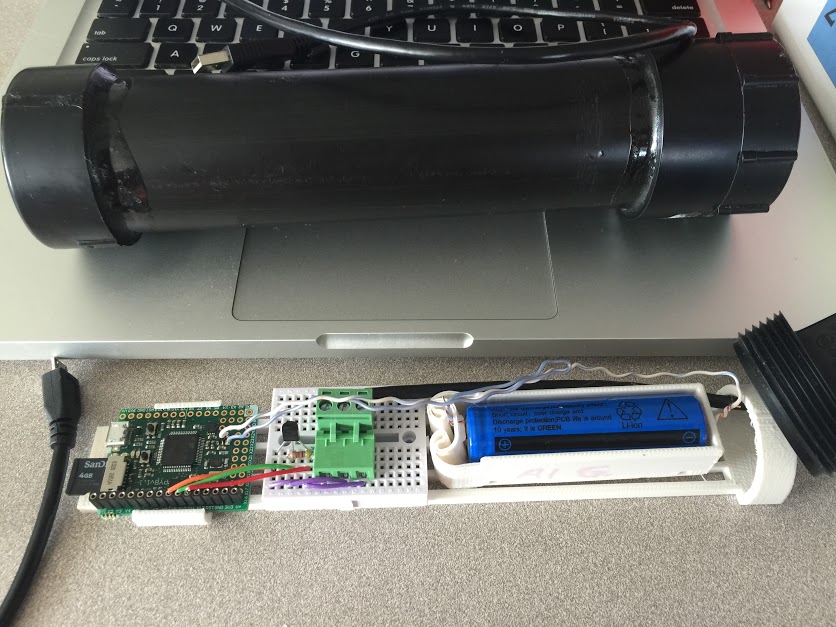
The entire new system with battery and PVC pipe that will serve as the waterproof casing.
Here’s the new system with temperature sensor inside the water proof casing.
The micro controller runs the programming language Python, actually a smaller version of Python with fewer libraries called micro Python so we got to do a little programming! Wednesday evening we tested our sensors. We put them in Portage Bay, near the UW’s Oceanography building (one of them) at 47.65N and -122.31W. It was a gorgeous sunny, clear day. We got them into the water at about 4:30pm on the 29th in a comfortable 69 degree day.
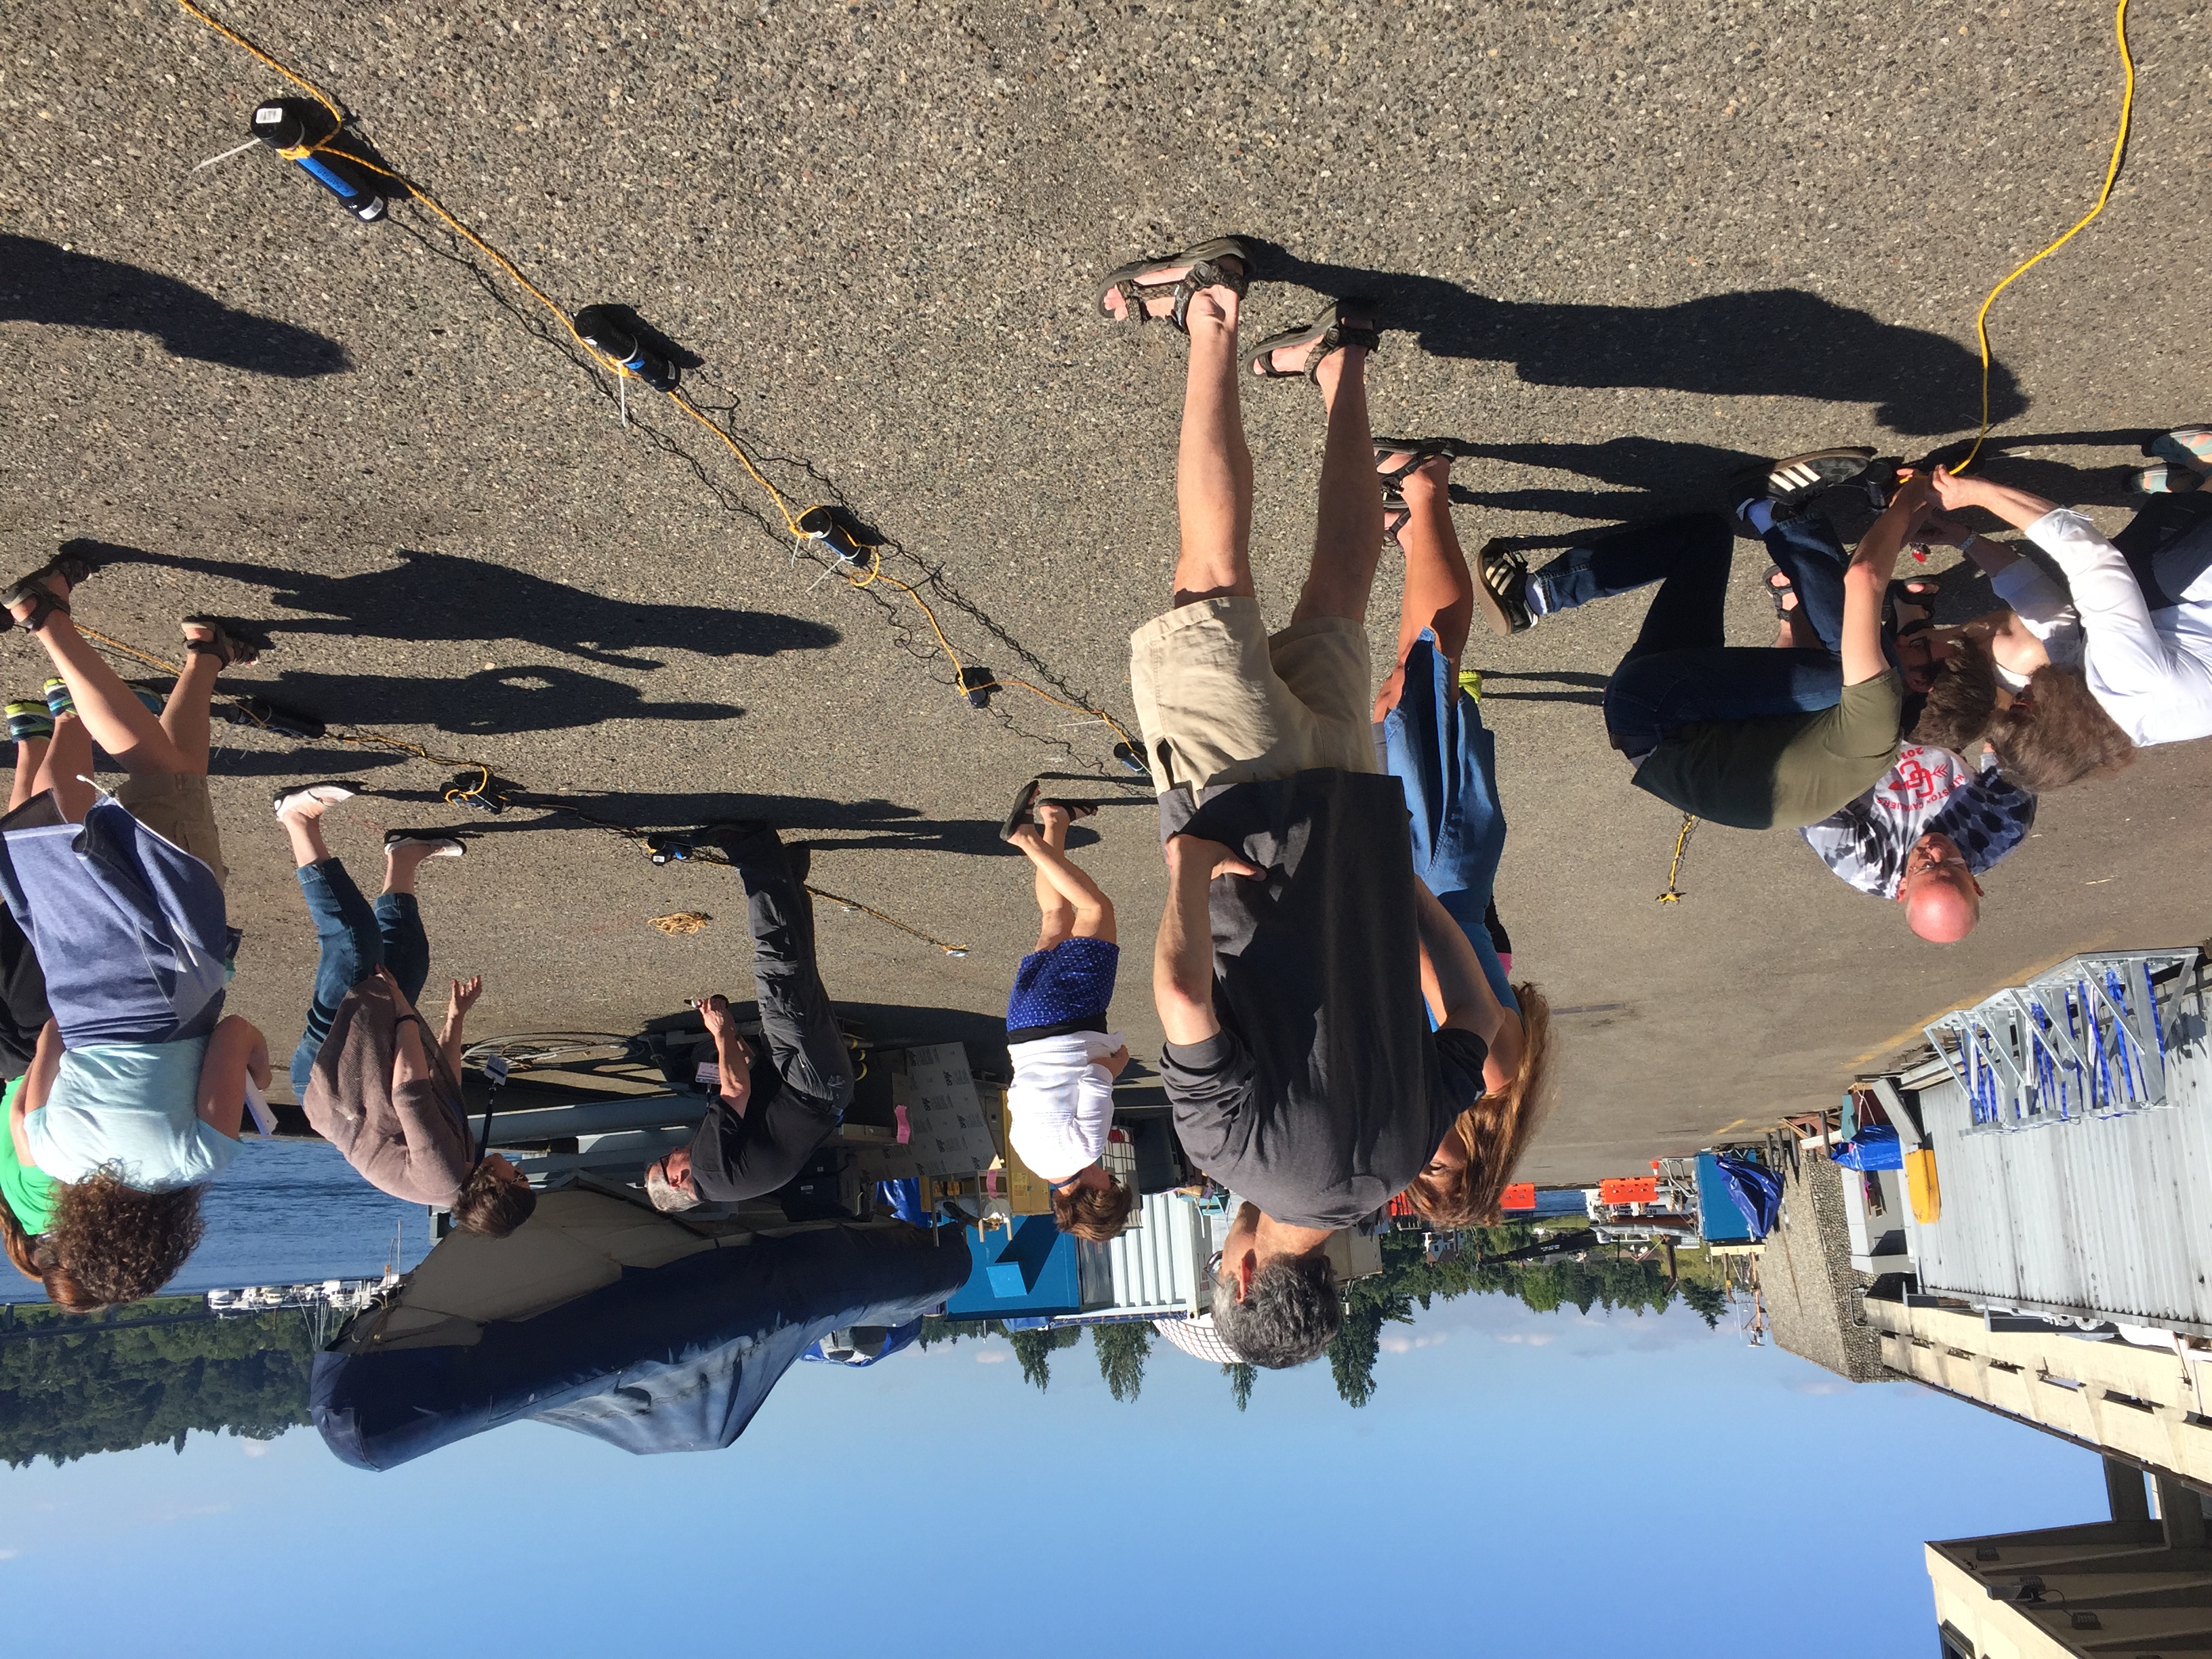
Here’s how we got our sensors into the water:
Since we had many sensors, we used a rope with zip ties and tape to attach the casings and the senors. A weight at the bottom of the rope ensured the sensors would be in the water at depth.
Getting the sensor systems on the rope.
We decided to double up so we attached two sensors at each depth, 2.5m in the water, 1.5m, .5m in the water and .5m above the surface of the water.
Almost ready to deploy the sensors in the bay!
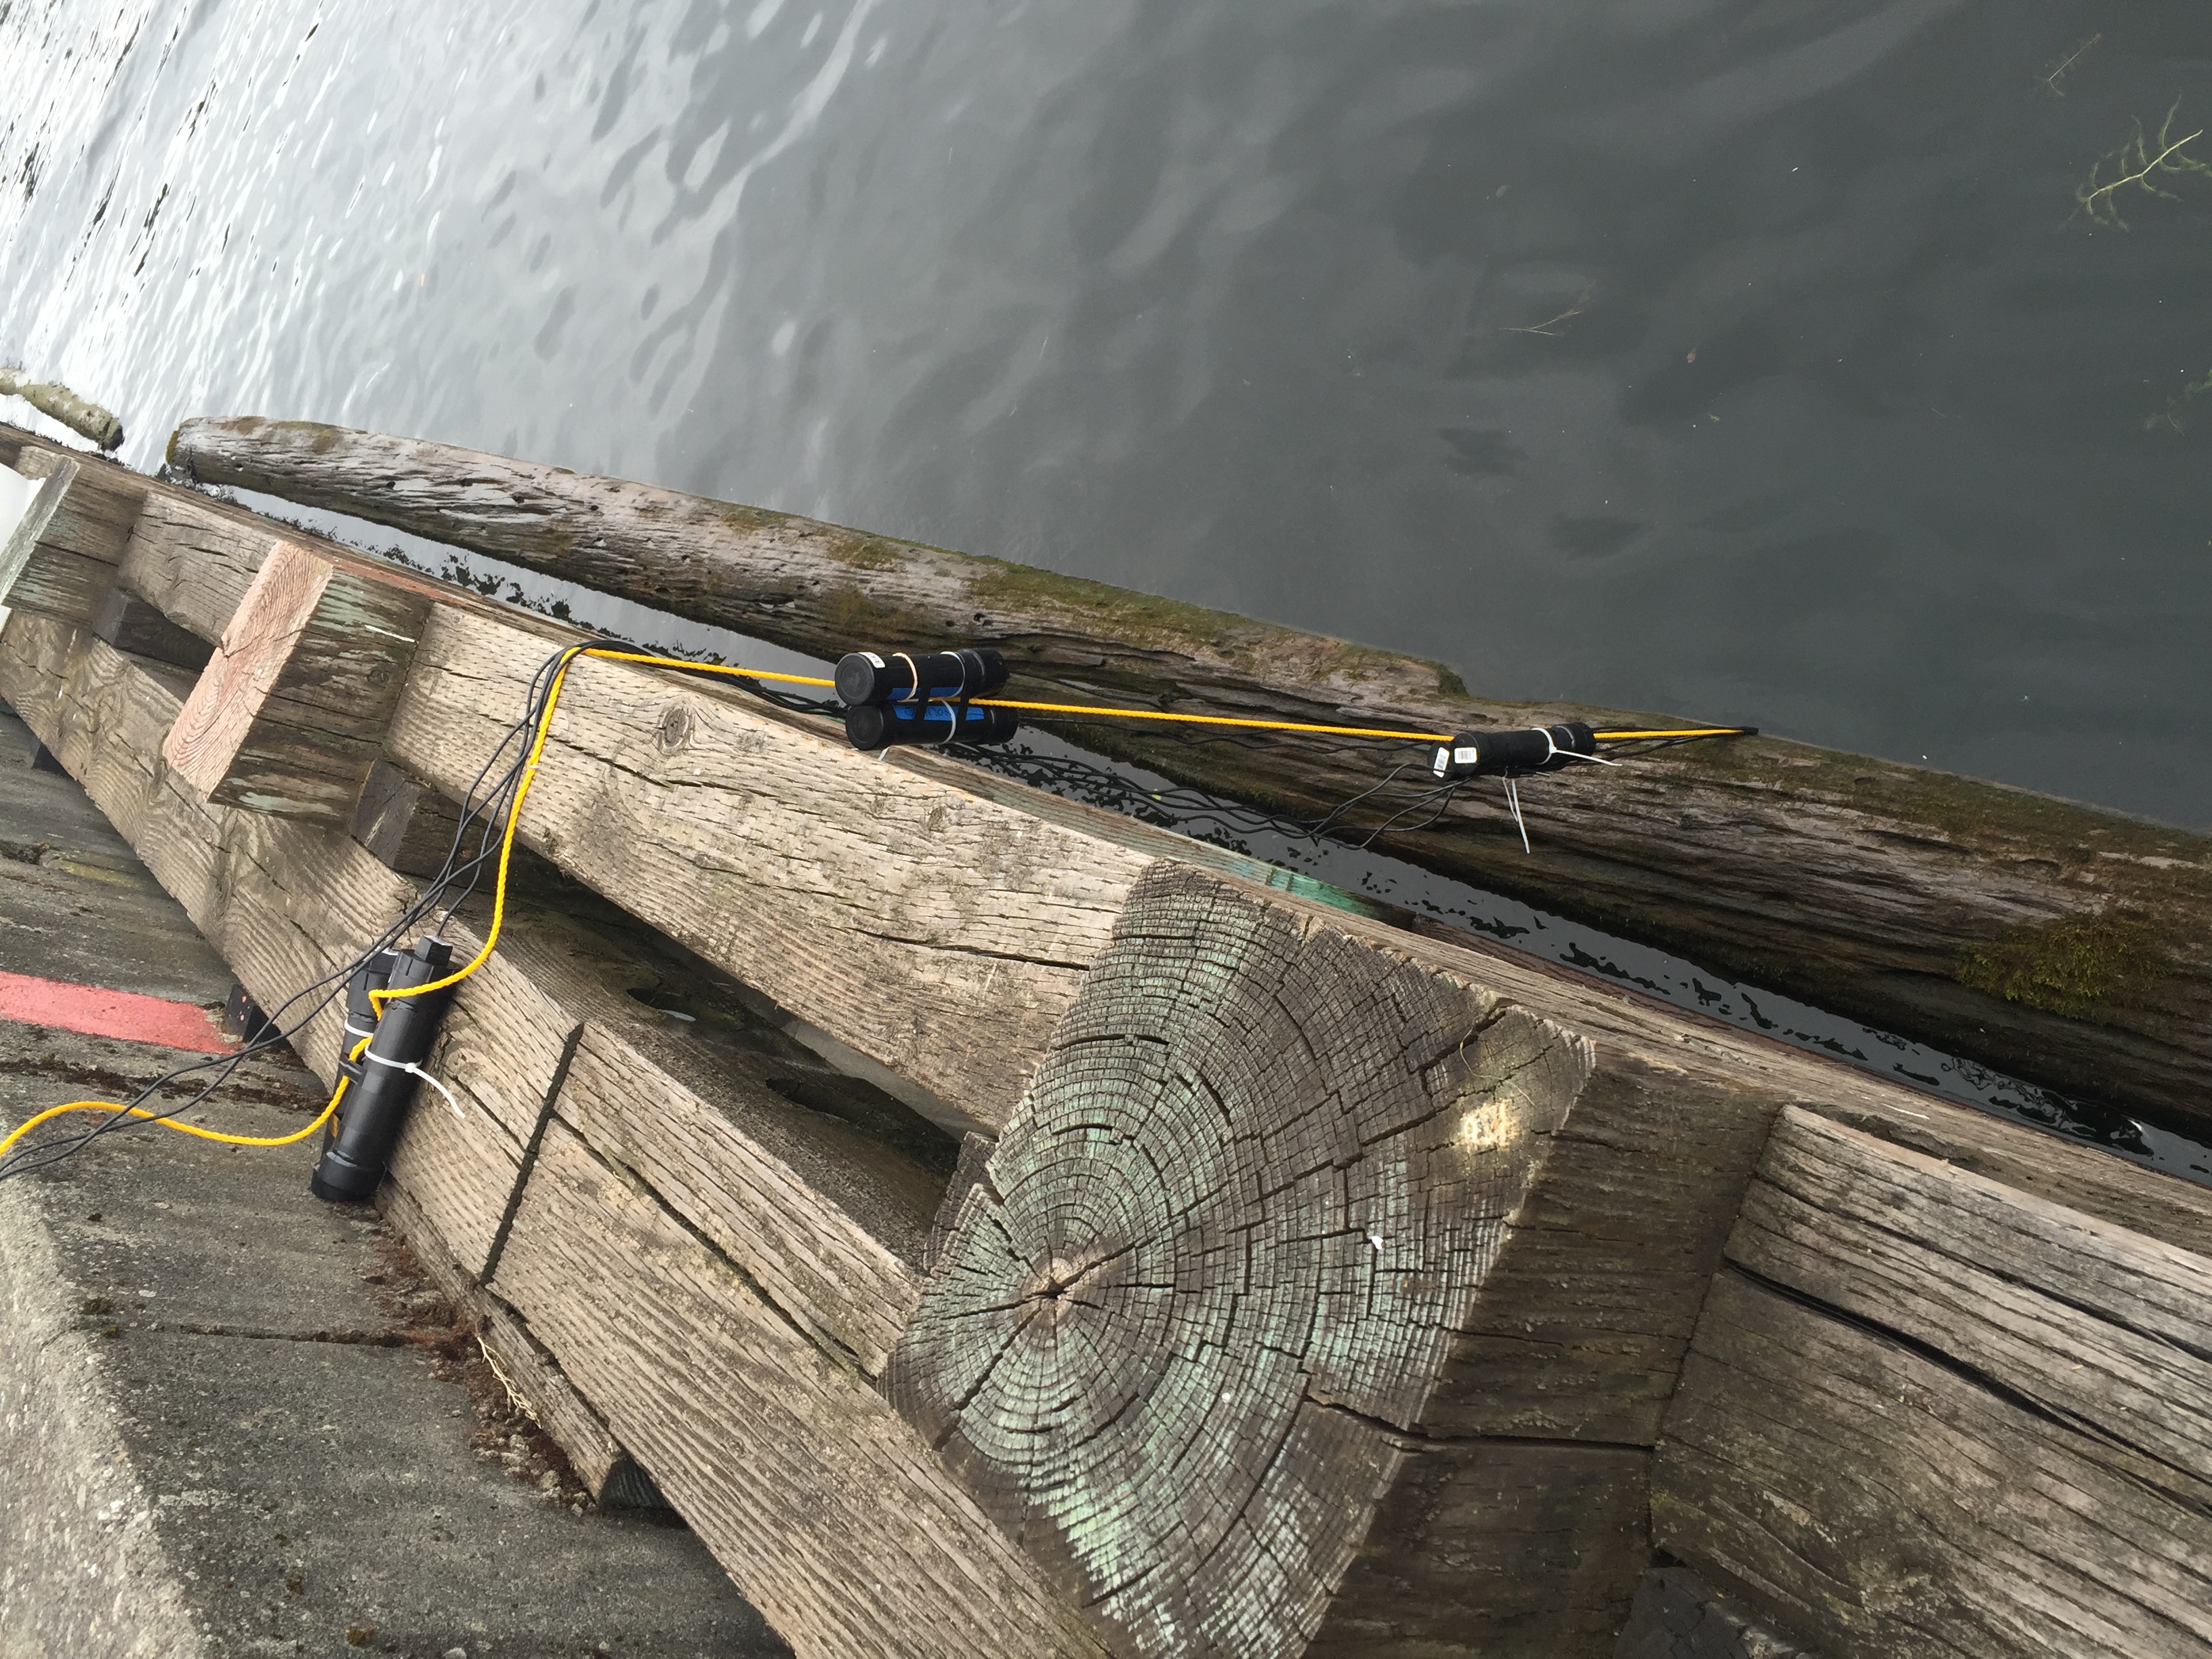
Sensors set and ready to be left overnight.
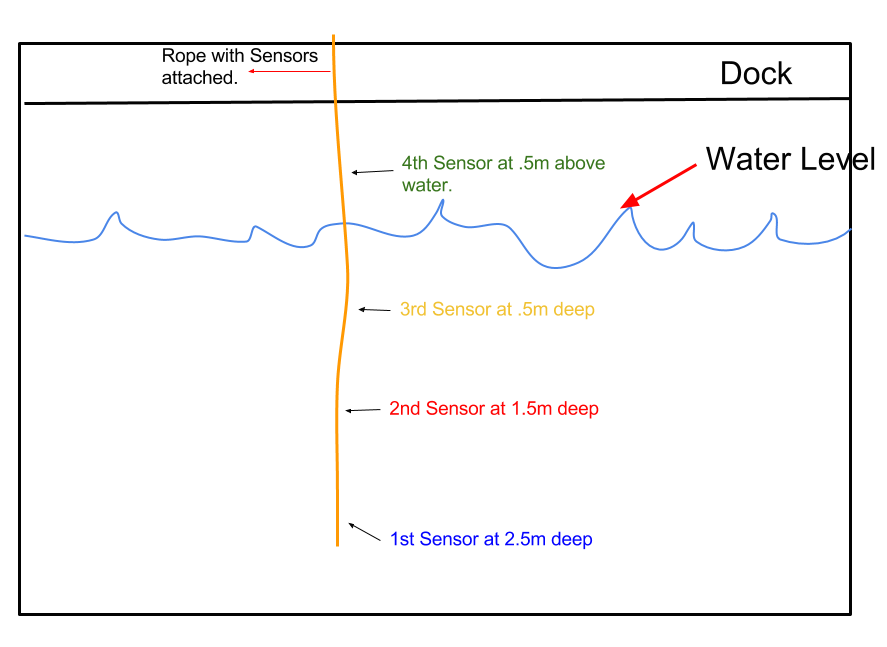
Scientific diagram of the sensor placement that I made using Google Drawings.
By 10:30am on Thursday, June 30, we retrieved our sensors and checked to see if they worked properly and recorded data. Mine worked and I got data! I had the interval set to collect temp every 20 seconds so I ended up with 3,512 data points! Here’s a graph comparing the built-in micro-controller temp sensor that was 2.5m above the water in the black waterproof PVC pipe casing and the external temp sensor at .5m under the water (click here to see copies of the graphs on a Google Doc):
The graph shows the temp rise abruptly as we attached the sensors the rope on the asphalt at the beginning as well as the dip in temp as we took the sensor out of the water and evaporation took place! In between we see the temp changing as the sun set and night took over.
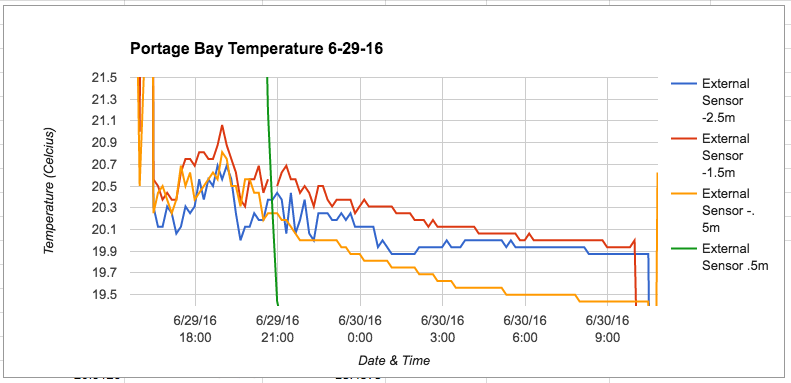
We were actually incredibly fortunate that we put two sensors at each depth because amazingly enough only one of the two sensors managed to collect data at each and every depth! What are the odds of that?? So what you see below is a graph comparing all four external temp sensors (click here to see copies of the graphs on a Google Doc):
The green line shows the temp change for the sensor that was .5m above the surface of the water. The yellow, red, and blue lines show the sensors that were .5m, 1.5m, and 2.5m under the water. This is cool stuff and I can’t wait to use these tools with my 6th graders next spring!
Here’s me zooming into the data to see how the temperature in the water changed at the different depths of .5m, 1.5m, and 2.5m:
Here’s a closer look at the temp data at the different depths.
Any ideas for me to think about in using this data collection tool or in having students analyze data? Please leave a comment. 🙂