While I don’t agree that standardized test scores should be used to inform more than what they inform, I do use the test scores to see what trends have been happening with my students. See, I’m not entirely opposed to using standardized test scores, just NOT to determine whether my students should advance or graduate and NOT to determine whether or not I’m an effective teacher. Come in and observe me, read my blog, see what my students are actually learning and doing and creating. Sorry, I ranted for a bit there. When looking for trends I’m only looking at what my previous students have done because once I see my 8th graders’ scores they are already in high school.
Data and the following charts obtained from the WA State Report Card:
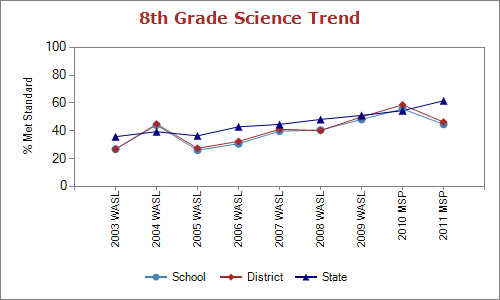
From 2005 to 2010 Chimacum 8th graders were making steady increases in the Science Washington Assessment of Student Learning test or WASL (which included the 2010 Measurement of Student Progress or MSP). Test scores increased every year from 26% to 56% passing. In 2011 year students took the MSP online for the first time and their scores dropped to 45% passing. Something about taking the test online completely threw off our 8th graders.
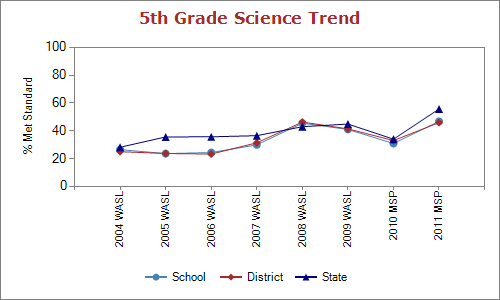
I have to include the 5th grade test scores because that way I can compare students to themselves (even though kids come and go at least I’m comparing mostly the same students to themselves three years later instead of the absurd comparing one year’s class to a whole different year’s class of students – apples and oranges anyone?). Our 8th graders from 2007 to 2010 increased scores by an average of +20% each year from their 5th grade scores. In 2011 there was no change (8th graders scored 45% passing in the 2011 Science MSP and in 2008 45% passed the 5th grade science WASL). Well, at least switching to an online test didn’t make them score worse than they did in 5th grade.
To an outsider it might seem that tests are affected by how students take them and learn to take them versus what students actually know. What I mean is that the data from 2010 to 2011 implies that the test is demonstrating how well they take tests and not how much they are learning or how much they know. Does anyone else deduce that from this trend?

I think that the more telling trend is between low income and non-low income students. From 2005 to 2010 low income students scored 19% to 48% (41% in 2011 – the online testing dip), while non-low income students scored from 38% to 62% (47% in 2011 – the online testing dip). This is consistent across the board every year. Part of our school improvement plan is to close the gap between our low income and non-low income students. So the next time somebody uses the, “pull themselves up by their boot straps,” logic or tells you that poverty doesn’t matter, tell them they are just plain wrong.